
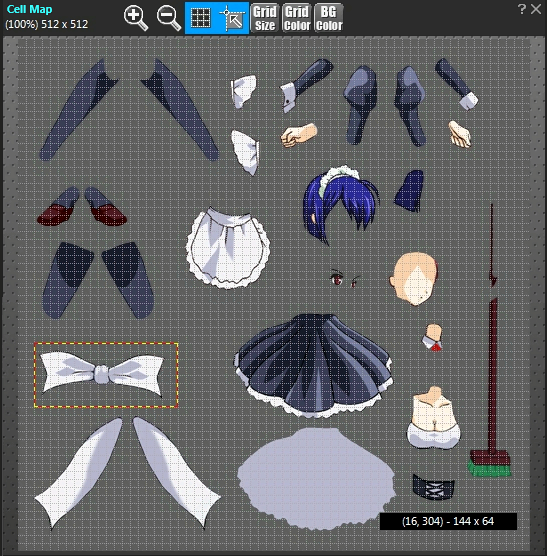
In the “Cell Map” window, the reference image of the cell map selected in the project window will be displayed.
With this window, the two kinds of operation largely can be implemented.
Operation By Toolbar
On the toolbar of the cell map window, buttons to change the display state of the reference image are accommodated mainly.
![]()
| It zooms and shows the reference image. The image can be enlarged up to 1600%. | |
| It reduces and shows the reference image. The image can be reduced down to 25%. | |
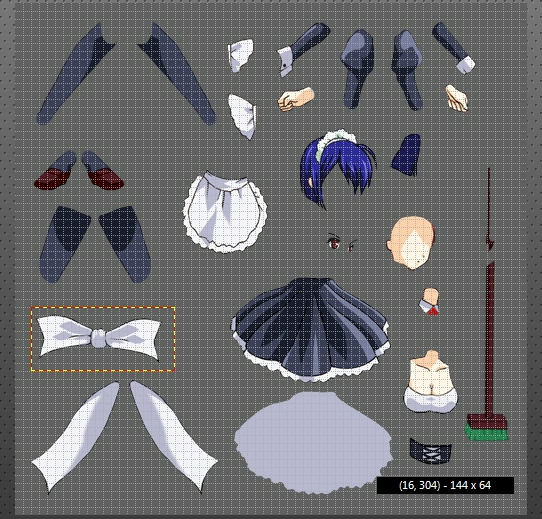
| It switches Show/Hide of the grid on the reference image. When the button’s background color is blue, Show. When it is gray, Hide.
With every click, this display switches alternately. |
|
| When the Specified Range and the Rectangle are moved, it snaps them to Grid. When the button’s background color is blue, Snap to Grid. When grey, Not Snap to Grid. The state is switched alternately by clicking the button. Also, even when the grid is not shown, it is possible to snap (meaning that it is separate from the grid’s shown state). | |
It changes the pixel intervals of grid. The setting dialog to input grid’s pixel intervals will open. So, input pixel intervals with a positive number.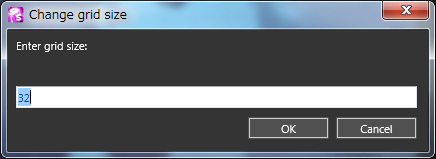 |
|
| Specify the color of the grid lines. By clicking the button, the color picker will be shown. Enter the preferred color herein. | |
| Specify the background color of the transparent part of the image. By clicking the button, the color picker will be shown. Enter the preferred color herein. |
 Also, when the whole cannot be shown such as the window’s breadth is too narrow, the two-triangle mark
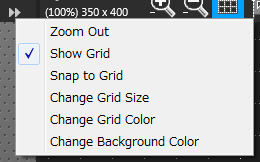
 ![]() is shown at the right side of the toolbar. By clicking this mark, the menu of the hidden buttons will open. By selecting from this menu, functions of the respective buttons can be implemented.
is shown at the right side of the toolbar. By clicking this mark, the menu of the hidden buttons will open. By selecting from this menu, functions of the respective buttons can be implemented.
The right figure is the menu of all the hidden buttons. In actual case, only the hidden buttons are shown.
Operation on Image
When a new range specified on the image, the rectangle is shown by the “white and black dotted line”. By double-clicking this rectangle (meaning to select “Create Cell” from the right click menu inside the rectangle), the area can be newly added to the “Cell List” as a “Cell”.
Also, the rectangles of the cell which are already registered in the cell list are shown by the “red and yellow dotted line”. By dragging this rectangle and changing the sizes, the pattern design of the already-existing cell can be changed.
With right-click inside the rectangle range area, the exclusive-use menu will open.
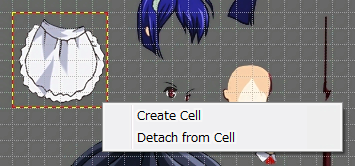
| Create Cell | It adds the currently-specified rectangle to the cell list as a new cell. |
|---|---|
| Detach from Cell | It cancels the relation of the already-existing cell and the rectangle and changes it to the new rectangle. Changes of the rectangle after this cancellation will not affect the originally existing cell. So, it is convenient when another new cell is desired to create by using the same shape and size as the already-existing cell. |